Metrics
With a Prometheus scraping it, omegga charts what it collects in the web UI.
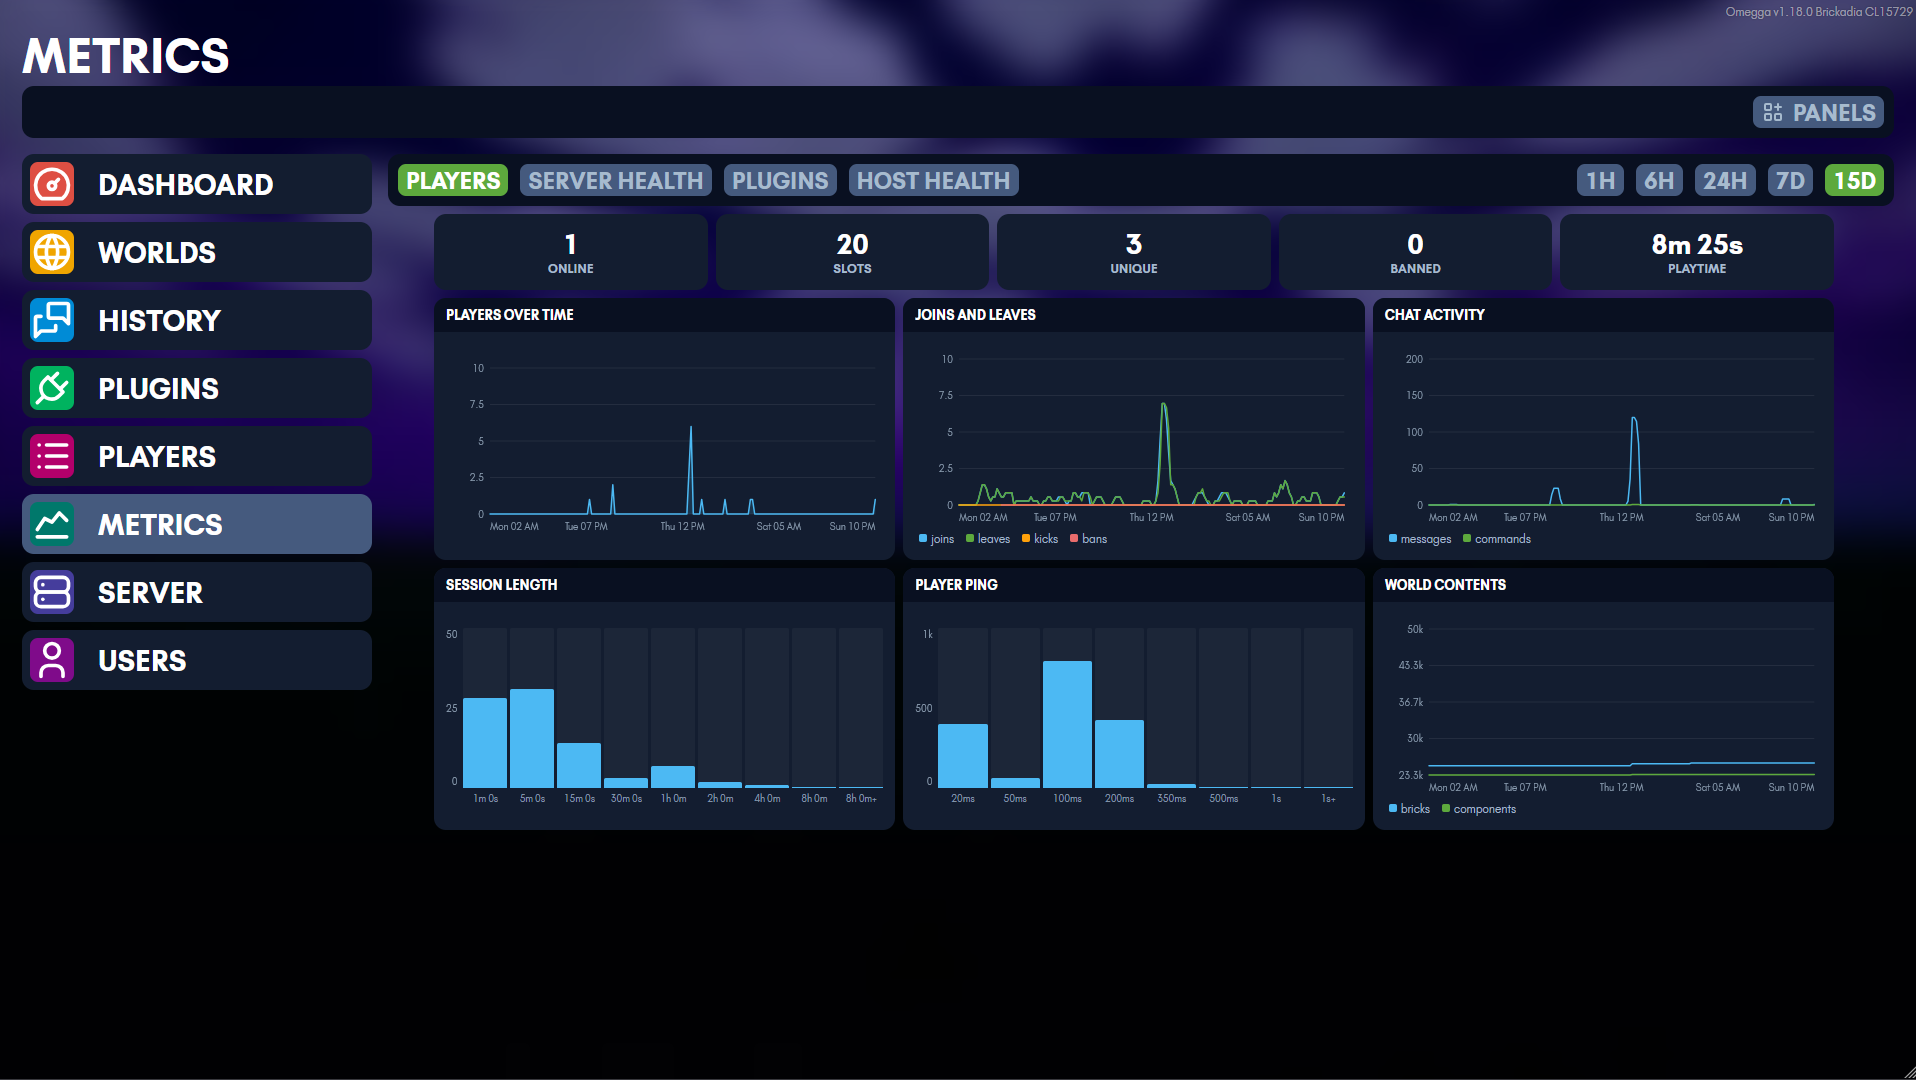
Getting there is two settings: the endpoint omegga serves, and the Prometheus it reads back from. Dashboards in the web UI covers the second.
Omegga can serve a Prometheus scrape endpoint, off by
default. It is a standalone HTTP server, so it works with omegga.webui: false
and binds to its own address and port.
metrics:
  enabled: true
  bind: '127.0.0.1'
  port: 9000
Or set METRICS_ENABLED=true, METRICS_BIND, METRICS_PORT.
# prometheus.yml
scrape_configs:
  - job_name: omegga
    static_configs:
      - targets: ['localhost:9000']
Security
The endpoint is unauthenticated, hence the loopback default. To expose it,
either front it with a reverse proxy or set metrics.token and have Prometheus
send it as authorization: { credentials: ... }. Omegga warns at startup if you
bind off-loopback without a token.
A Prometheus to scrape it
If you do not already run one, this is enough to stand a scraper up next to omegga. It assumes omegga runs on the host and Prometheus runs in docker; for omegga in a container too, skip to the whole stack in compose.
# compose.yml
services:
  prometheus:
    image: prom/prometheus:v3.14.0
    restart: unless-stopped
    command:
      - '--config.file=/etc/prometheus/prometheus.yml'
      - '--storage.tsdb.path=/prometheus'
      - '--storage.tsdb.retention.time=15d'
    volumes:
      - ./prometheus.yml:/etc/prometheus/prometheus.yml:ro
      - ./omegga.token:/etc/prometheus/omegga.token:ro
      - prometheus:/prometheus
    # omegga runs on the host, not on this network
    extra_hosts:
      - 'host.docker.internal:host-gateway'
    ports:
      - '127.0.0.1:9090:9090'

volumes:
  prometheus:
# prometheus.yml
global:
  scrape_interval: 15s

scrape_configs:
  - job_name: omegga
    authorization:
      credentials_file: /etc/prometheus/omegga.token
    static_configs:
      - targets: ['host.docker.internal:9000']
        labels:
          instance: server-1
omegga.token holds the same string as metrics.token, and nothing else.
Prometheus does not expand environment variables in its config file, which is
why the token goes in a file rather than inline.
Three things that are easy to get wrong:
- The default bind is unreachable from a container.
metrics.binddefaults to127.0.0.1, which is the host’s loopback and not one any container shares. SetMETRICS_BIND=0.0.0.0, and setmetrics.tokenin the same change, or the endpoint is on your LAN unauthenticated. - Prometheus itself has no authentication. Publishing it on
127.0.0.1:9090keeps its API off the network while leaving it reachable from the host, which is all the web UI dashboards need. instanceis what those dashboards filter on. Whatever you label the target here is whatmetrics.prometheus.instancehas to be set to. Several omeggas is one moretargetsentry each, with a distinctinstance.
Local storage is capped by --storage.tsdb.retention.time. To keep more than
that, remote_write into something built for it rather than raising the
retention; the web UI reads back at most metrics.prometheus.retentionDays
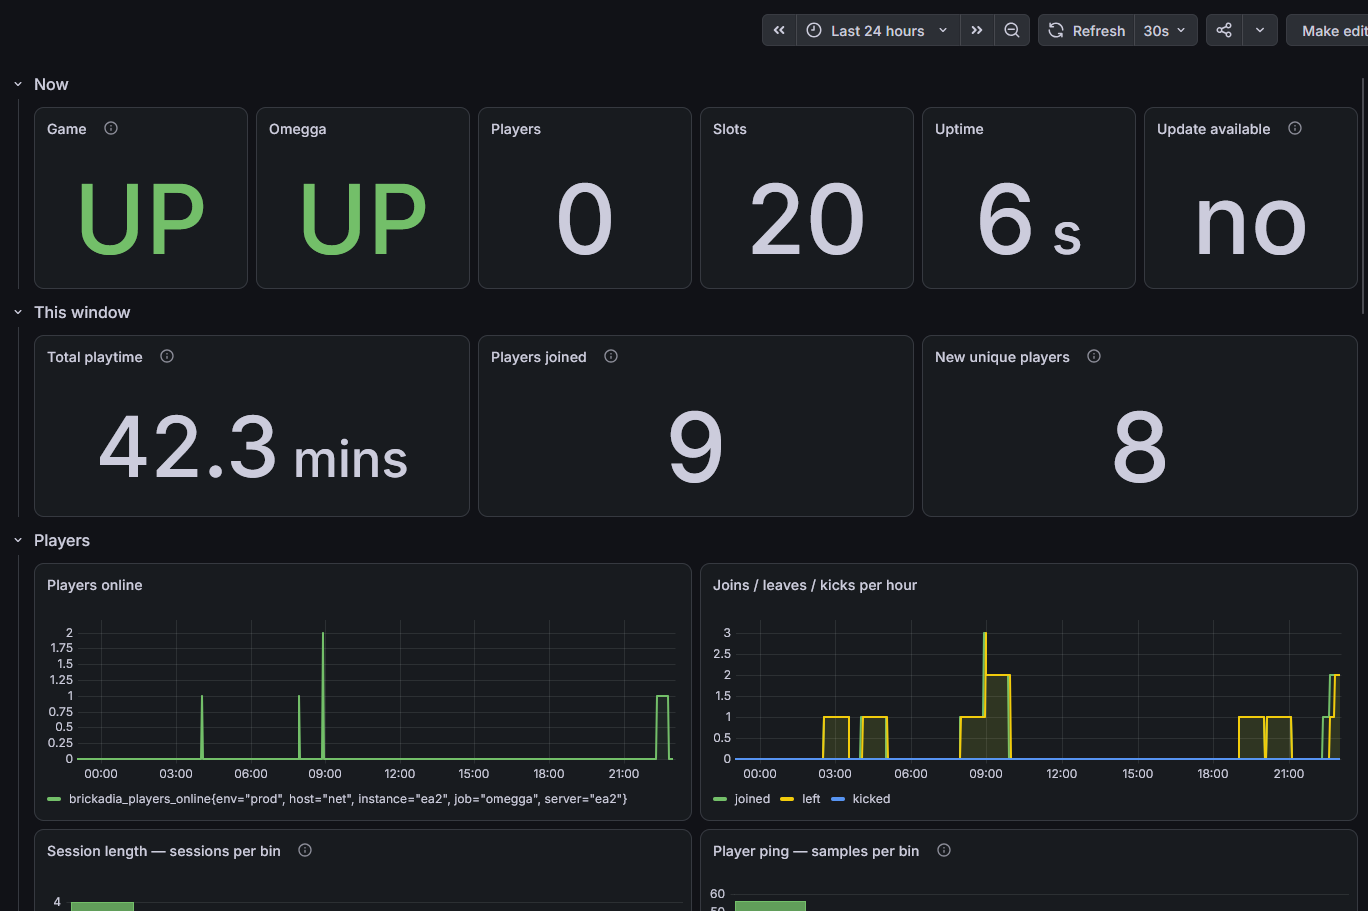
regardless. Grafana pointed at the same Prometheus works if you want dashboards
beyond the built-in ones.
The whole stack in compose
Running omegga in a container puts it on the same network as the scraper, so the metrics port never has to be published and the scraper reaches it by service name. VictoriaMetrics scrapes omegga itself and answers the queries the web UI makes, so there is one storage service rather than a buffer in front of a long term store.
Four files, in one directory:
.
├── compose.yaml
├── .env
├── omegga.token
├── scrape.yml
└── server/
    └── omegga-config.yml
server/ is the bind mount, so server/omegga-config.yml is what omegga sees
at /server/omegga-config.yml. Write it before the first up, or let omegga
generate a default one and edit it afterwards.
# compose.yaml
services:
  omegga:
    image: ghcr.io/brickadia-community/omegga:latest
    restart: unless-stopped
    stdin_open: true
    tty: true
    env_file: .env
    ports:
      - '${OMEGGA_PORT}:${OMEGGA_PORT}/tcp'
      - '${BRICKADIA_PORT}:${BRICKADIA_PORT}/udp'
    volumes:
      - home:/home/steam
      - ./server:/server

  victoriametrics:
    image: victoriametrics/victoria-metrics:v1.150.0
    restart: unless-stopped
    command:
      - '-storageDataPath=/storage'
      - '-retentionPeriod=2y'
      - '-httpListenAddr=:8428'
      - '-promscrape.config=/etc/vm/scrape.yml'
    volumes:
      - ./scrape.yml:/etc/vm/scrape.yml:ro
      - ./omegga.token:/etc/vm/omegga.token:ro
      - victoriametrics:/storage

volumes:
  home:
  victoriametrics:
# scrape.yml - the same scrape_configs prometheus takes
global:
  scrape_interval: 15s

scrape_configs:
  - job_name: omegga
    authorization:
      credentials_file: /etc/vm/omegga.token
    static_configs:
      - targets: ['omegga:9000']
        labels:
          instance: server-1
# server/omegga-config.yml
omegga:
  port: 8080
  webui: true
  https: true
server:
  port: 7777
  map: Plate
metrics:
  enabled: true
  # the container's own network interface, not the host's
  bind: 0.0.0.0
  port: 9000
  # the same string as ./omegga.token
  token: CHANGE_ME
  prometheus:
    enabled: true
    url: http://victoriametrics:8428
    instance: server-1
    retentionDays: 730
# .env, read for the ${...} in compose.yaml, and passed to the container
BRICKADIA_TOKEN=...
OMEGGA_PORT=8080
BRICKADIA_PORT=7777
PUID=1000
PGID=1000
# the token, with no trailing newline
printf '%s' 'CHANGE_ME' > omegga.token
chmod 600 omegga.token
Then docker compose up -d.
Why the metrics settings are in the config file rather than the environment:
metrics.token is the one field with no environment variable, and having half
the block in each place is worse than having all of it in one. METRICS_ENABLED,
METRICS_BIND, and METRICS_PORT still work if you would rather template them.
A few things this arrangement is doing on purpose:
- VictoriaMetrics publishes no port. It has no authentication, and its HTTP
API includes both writes and series deletion, so being unreachable is what
protects it. Add
ports: - '127.0.0.1:8428:8428'if you want its UI on the host; that keeps it off the network while making it reachable locally. - The metrics port is not published either, and does not need to be. Only
victoriametricstalks to it, over the compose network. The token is still set because omegga warns about an off-loopback bind without one, and because anything else you later attach to that network could otherwise read it. instance: server-1appears twice, in the scrape config and inmetrics.prometheus.instance. They have to agree or the dashboards query unfiltered and chart every scraped server at once. A second omegga is another service, anothertargetsentry, and a distinctinstance.- 2 year retention. You can edit
'-retentionPeriod=2y'to be longer.retentionDayshas to match whatever you set, since it caps how far back the web UI range picker reaches: leaving it at 15 would hide almost everything stored. Thevictoriametricsvolume is the one worth backing up.
VictoriaMetrics answers the same /api/v1/query and /api/v1/query_range that
omegga uses, which is why metrics.prometheus.url points at it directly. A
Prometheus in front of it, buffering and writing through with remote_write,
is a reasonable arrangement too, but it is a second service to run for storage
this already does.
Game metrics
| metric | type | description |
|---|---|---|
brickadia_server_info | gauge | Build and config as labels (version, server_name, map, steambeta, port); always 1 |
brickadia_up | gauge | 1 when the game is running with a map loaded, from its start/stop log events |
brickadia_status_responsive | gauge | 1 when the last status poll was answered; absent until one is attempted |
brickadia_server_state | gauge | State set: 1 on the active state of starting/running/stopping/stopped/updating |
brickadia_starting, brickadia_stopping, brickadia_updating | gauge | The same states as flat booleans, easier to alert on |
brickadia_uptime_seconds, brickadia_start_time_seconds | gauge | Uptime and last start |
brickadia_players_online, brickadia_players_max | gauge | Connected players and slots |
brickadia_bricks_count, brickadia_components_count | gauge | World contents |
brickadia_entities_count | gauge | Entities, when the game reports them |
brickadia_status_age_seconds | gauge | Age of the cached server status |
brickadia_update_available | gauge | Whether an update was found at the last check |
brickadia_update_check_timestamp_seconds, brickadia_last_update_timestamp_seconds | gauge | Last update check and last completed update |
brickadia_players_joined_total | counter | Player joins |
brickadia_players_joined_unique_total | counter | Distinct players since omegga started |
brickadia_players_left_total, brickadia_players_kicked_total | counter | Disconnects and kicks |
brickadia_players_banned_total | counter | Bans issued |
brickadia_bans_active, brickadia_bans_listed | gauge | Bans in force, and every ban list entry including expired ones |
brickadia_player_playtime_seconds_total | counter | Total player-seconds connected; accrues live, so in-progress sessions count |
brickadia_chat_messages_total | counter | Chat messages |
brickadia_commands_total, brickadia_unknown_commands_total | counter | Chat commands run |
brickadia_interactions_total | counter | Brick interactions |
brickadia_log_lines_total, brickadia_stderr_lines_total | counter | Game log throughput; a flatline is the earliest sign it has wedged |
brickadia_starts_total, brickadia_stops_total, brickadia_crashes_total | counter | Lifecycle events |
brickadia_map_changes_total, brickadia_autorestarts_total, brickadia_updates_total | counter | Map changes, autorestarts, updates |
brickadia_status_poll_failures_total | counter | Status polls that timed out or failed to parse |
brickadia_player_session_seconds | histogram | How long players stayed connected |
brickadia_player_ping_seconds | histogram | Player ping, sampled once per status poll |
brickadia_status_poll_duration_seconds | histogram | How long Server.Status took, a good proxy for game hitching |
brickadia_process_cpu_seconds_total | counter | CPU consumed by the game process (Linux) |
brickadia_process_resident_memory_bytes, brickadia_process_start_time_seconds, brickadia_process_open_fds | gauge | Game process stats from /proc (Linux) |
World stats come from a Server.Status console command, cached and refreshed at
most once per statusMaxAge seconds however many servers scrape. A scrape
serves the cache and refreshes in the background, so an unresponsive game reads
brickadia_up 0 instead of stalling the scrape. Any integer line in the status
header is exported as brickadia_<name>_count, so stats a future build starts
reporting appear on their own.
Omegga metrics
| metric | type | description |
|---|---|---|
omegga_build_info | gauge | Version, node version, platform, containerized; always 1 |
omegga_up, omegga_start_time_seconds | gauge | Liveness and start time |
omegga_webserver_up | gauge | Whether the web UI is serving |
omegga_plugins_scanned, omegga_plugins_enabled, omegga_plugins_loaded | gauge | Plugin counts |
omegga_plugin_info, omegga_plugin_loaded, omegga_plugin_enabled | gauge | Per-plugin state, labelled by plugin |
omegga_uncaught_exceptions_total | counter | Exceptions reaching the process handler |
omegga_unhandled_rejections_total | counter | Promise rejections reaching the process handler |
omegga_plugin_errors_total | counter | Plugin load, unload, and runtime failures, by plugin |
omegga_plugin_metrics_series | gauge | Series each plugin is exporting |
omegga_plugin_metrics_dropped_total, omegga_plugin_metrics_errors_total | counter | Plugin metrics hitting the limits, or whose collect() threw |
omegga_metrics_collect_errors_total | counter | Omegga’s own collectors that threw and were skipped |
omegga_host_cpu_ratio, omegga_host_memory_*, omegga_host_disk_* | gauge | Host utilization (sampled by the web UI heartbeat; absent when it is off) |
omegga_host_network_receive_bytes_total, omegga_host_network_transmit_bytes_total | counter | Host network totals (Linux) |
omegga_scrapes_total, omegga_scrape_duration_seconds | counter, histogram | The endpoint’s own stats |
Omegga exits after an uncaught exception, so a scrape usually will not catch
omegga_uncaught_exceptions_total incrementing; the target going down is the
signal. omegga_plugin_errors_total keeps a series for plugins that have since
unloaded, so a crash loop stays visible.
With defaultMetrics: true (the default) the standard process_* and
nodejs_* metrics are included under their conventional names.
Plugin metrics
Plugins get a metrics object as a fourth constructor argument, alongside
store. Everything registered is exported as
omegga_plugin_<plugin>_<metric>, with the plugin’s real name as a plugin
label.
import OmeggaPlugin, { OL, PS, PC, PM } from 'omegga';

export default class Plugin implements OmeggaPlugin<Config, Storage> {
  omegga: OL;
  config: PC<Config>;
  store: PS<Storage>;
  metrics: PM;

  constructor(omegga: OL, config: PC<Config>, store: PS<Storage>, metrics: PM) {
    this.omegga = omegga;
    this.config = config;
    this.store = store;
    this.metrics = metrics;
  }

  async init() {
    // omegga_plugin_my_plugin_kills_total{plugin="my plugin",weapon="pistol"}
    const kills = this.metrics.counter({
      name: 'kills_total',
      help: 'Kills by weapon',
      labels: ['weapon'],
    });
    this.omegga.on('cmd:kill', () => kills.inc({ weapon: 'pistol' }));

    // gauges push with set()/inc()/dec() or pull with collect()
    this.metrics
      .gauge({ name: 'queue_size', help: 'Queued' })
      .collect(() => this.queue.length);

    // histograms observe values, or time a block
    const done = this.metrics
      .histogram({ name: 'lookup_seconds', help: 'Lookups', buckets: [0.1, 1] })
      .startTimer();
    await this.lookup();
    done();
  }
}
A plugin’s metrics are dropped when it unloads or crashes, so a dead plugin’s
last values are never scraped as if live. A collect() that throws leaves that
metric at its last value and bumps omegga_plugin_metrics_errors_total, without
affecting the rest of the scrape. Worker and RPC plugin metrics render from the
last snapshot the host received and run no plugin code during a scrape, so a
hung plugin goes stale rather than delaying it.
Limits. At most 64 metrics per plugin, 1000 label combinations each, 8 label
names. Going over yields a no-op handle or a dropped series, counted by
omegga_plugin_metrics_dropped_total. Those limits are a backstop, not a
licence: never label with a player name, ID, brick, or position. Label
with things you can enumerate ahead of time.
RPC plugins push a metrics notification carrying the same snapshot, as
often as they like:
{
  "jsonrpc": "2.0",
  "method": "metrics",
  "params": [
    {
      "type": "counter",
      "name": "omegga_plugin_my_plugin_kills_total",
      "help": "Kills by weapon",
      "samples": [{ "labels": { "weapon": "pistol" }, "value": 12 }]
    }
  ]
}
Histogram families also carry buckets (ascending upper bounds); their samples
carry counts (one per bucket plus a trailing +Inf slot, not cumulative),
sum, and count. Names must start with the plugin’s own prefix.
Dashboards in the web UI
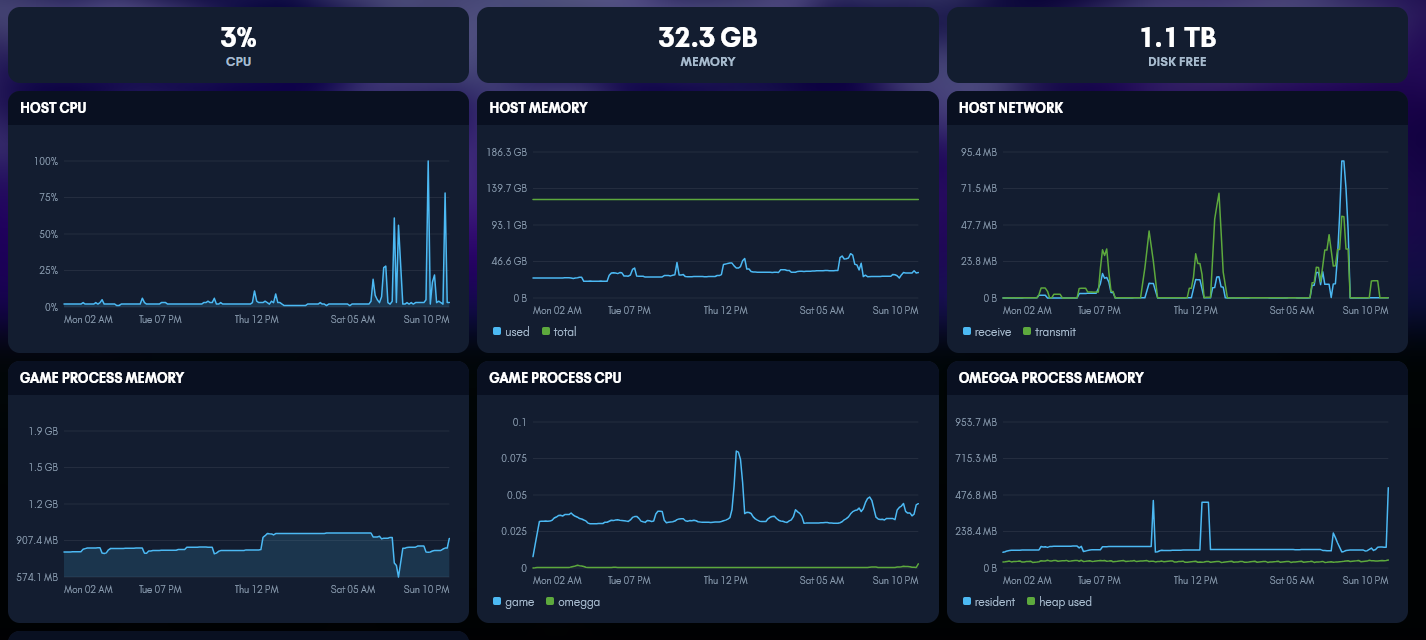
Omegga can also read those metrics back out of a Prometheus that scrapes it, and chart them in the web UI. Off unless configured:
metrics:
  prometheus:
    enabled: true
    url: http://127.0.0.1:9090
    instance: server-1 # the `instance` label identifying this omegga's series
Or METRICS_PROMETHEUS_ENABLED, _URL, _INSTANCE, _TIMEOUT. Also
available: timeout (seconds, default 3), cacheSeconds (default 15), and
retentionDays (default 15), which limits how far back the range picker
reaches.
Set instance to whatever your scrape config relabels this server to. Without
it every query runs unfiltered, so a Prometheus scraping two servers charts
both at once. Only [A-Za-z0-9_.:-] is accepted, because the value goes into a
PromQL label matcher.
A Metrics entry then appears in the nav for users holding any of the
metrics.* permissions, with four dashboards: players, server health,
plugins, and host health. Each has its own permission, so a moderator
can see player activity without seeing the machine. Panels can be hidden per
dashboard from the Panels menu; that choice is per browser. Hovering a panel
header explains what it measures.
Two things the UI does not do, deliberately:
- It never accepts PromQL from the browser. Panels are a fixed catalog in
dashboards.tsand the client asks for them by name. A Prometheus scraping omegga is usually scraping everything else its operator runs, so a pass-through?query=would make the web UI a read interface for all of it. - It never writes config. The connection is file and environment only.
If Prometheus is unreachable the dashboards say so instead of rendering empty
charts, and a panel whose query fails reports it in place without disturbing
the rest. “Reachable but holds nothing for this instance” gets its own message,
since the usual cause is a scrape config that relabels differently than
instance expects.